Yara Hoffmann · 3 November 2026
Palmcrest Housing Market Trends Reflect Broader Regional Changes
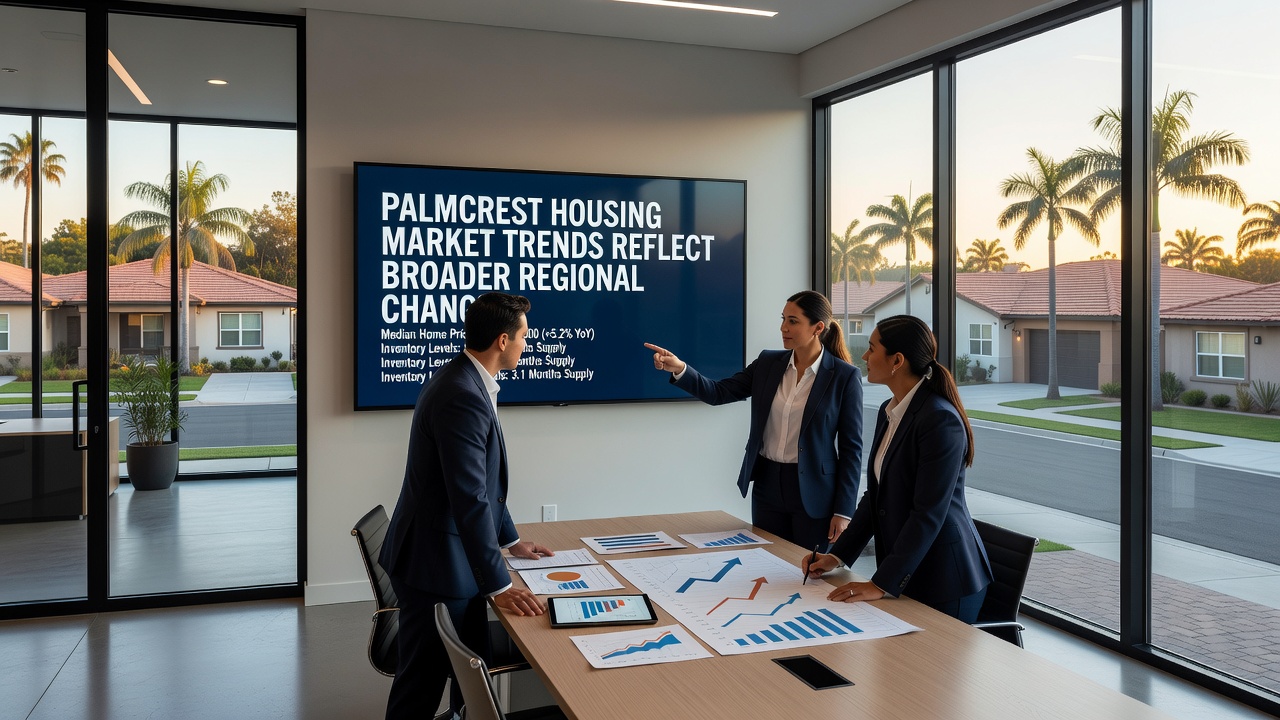
In November 2026, Palmcrest housing data reveals median sale prices climbing to $685,000 while inventory levels sit at 2.8 months of supply according to local real estate records and sales volume increased 12 percent year over year. These figures align with patterns observed across the broader coastal region where similar price growth and moderate inventory constraints appear in multiple communities. Observers note that buyer demand remains steady even as interest rates hover near 5.8 percent because employment gains in technology and logistics sectors continue to draw new residents.
Market Indicators and Sales Activity
Transaction records from the Palmcrest Multiple Listing Service indicate that single-family homes accounted for 68 percent of closings through the first ten months of 2026 while condominium sales rose 9 percent compared with the same period in 2025. Average days on market shortened to 27 days, and properties priced between $550,000 and $750,000 moved fastest. Data from the regional Multiple Listing Service network shows parallel tightening in neighboring coastal counties where median prices advanced 7.4 percent over the same timeframe.
Building permit data released by the county planning department lists 1,240 new residential units approved in Palmcrest during 2026, with multifamily projects representing 42 percent of that total. Construction starts lag behind permit issuance because material costs remain elevated and labor shortages persist in skilled trades. Those who've tracked the sector point out that the lag contributes to continued pressure on existing stock.
Regional Economic and Demographic Shifts
Employment figures compiled by the state labor department show Palmcrest adding 3,800 jobs in the twelve months ending October 2026, concentrated in professional services and distribution. Migration statistics from the US Census Bureau indicate net in-migration of 2,150 households into the county, many relocating from higher-cost metropolitan areas inland. Similar inflows appear in adjacent coastal markets where analysts at Statistics Canada have documented parallel movement patterns along the Pacific corridor in their most recent quarterly reports.
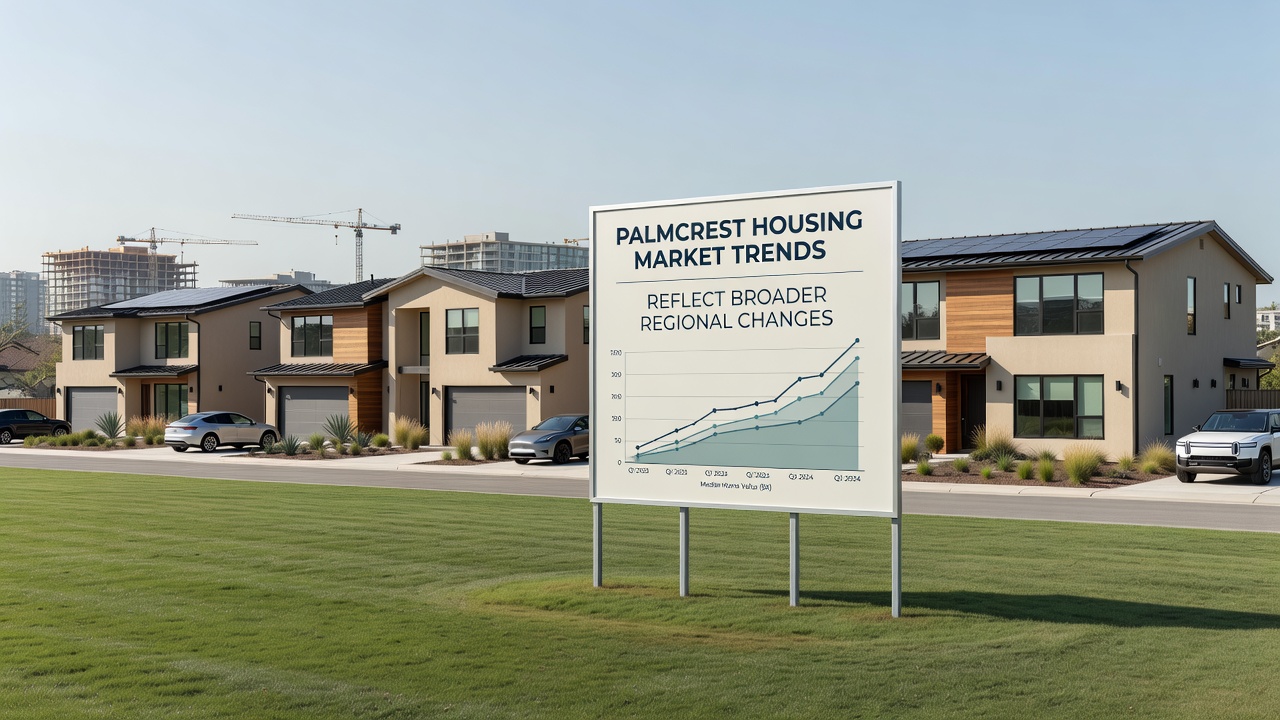
Housing affordability metrics released by the local housing authority place the median income required to purchase the median home at $148,000 annually, up from $139,000 two years earlier. Rent growth averaged 4.1 percent over the past year, with one-bedroom units reaching $2,150 on average. These changes mirror regional reports where the OECD housing affordability index notes comparable pressure across developed coastal economies facing constrained supply and steady employment expansion.
Infrastructure and Policy Influences
Completed roadway improvements along the northern corridor reduced average commute times by 11 minutes according to traffic department measurements taken in October 2026. The projects coincide with increased home sales in previously less accessible neighborhoods. Local zoning amendments passed in early 2026 allow higher density on select commercial corridors, yet few projects have broken ground because financing terms tightened for multifamily developers. Observers tracking the approvals note that the policy shift aims to address long-term supply shortfalls without immediate construction surges.
Insurance costs rose 14 percent for coastal properties following updated risk models released by the state insurance commission in September 2026. Properties within 500 meters of the shoreline experienced the largest adjustments, prompting some sellers to lower asking prices by 3 to 5 percent to offset buyer concerns. Comparable adjustments appear in other regional markets facing similar actuarial recalibrations.
Buyer and Seller Behavior Patterns
Buyer profiles compiled by local title companies show first-time purchasers representing 31 percent of transactions, down from 37 percent in 2024, while investors and second-home buyers increased their share to 24 percent. Cash transactions accounted for 28 percent of sales, concentrated in the upper price tiers. Sellers who listed homes priced above $900,000 often accepted offers 2.5 percent below asking after an average of 42 days, whereas lower-priced homes frequently received multiple offers within the first week.
These behavioral trends track with broader regional data where employment stability and remote-work flexibility continue to shape household location decisions. Analysts at the Australian Bureau of Statistics have recorded similar investor participation increases in comparable coastal markets during their latest housing outlook release.
Conclusion
November 2026 data positions Palmcrest housing activity as consistent with documented regional movements in employment, migration, and supply constraints. Permit activity, sales velocity, and price trajectories align with patterns measured across neighboring counties and international coastal benchmarks. Ongoing infrastructure work and zoning adjustments continue to influence future inventory levels while insurance and financing conditions shape immediate buyer decisions. The market therefore operates within the same structural parameters observed throughout the wider region.