Cameron Wolf · 22 September 2026
Palmcrest Retail Landscape Transforms as Visitor Numbers Climb and Artisan Stalls Fill Side Streets
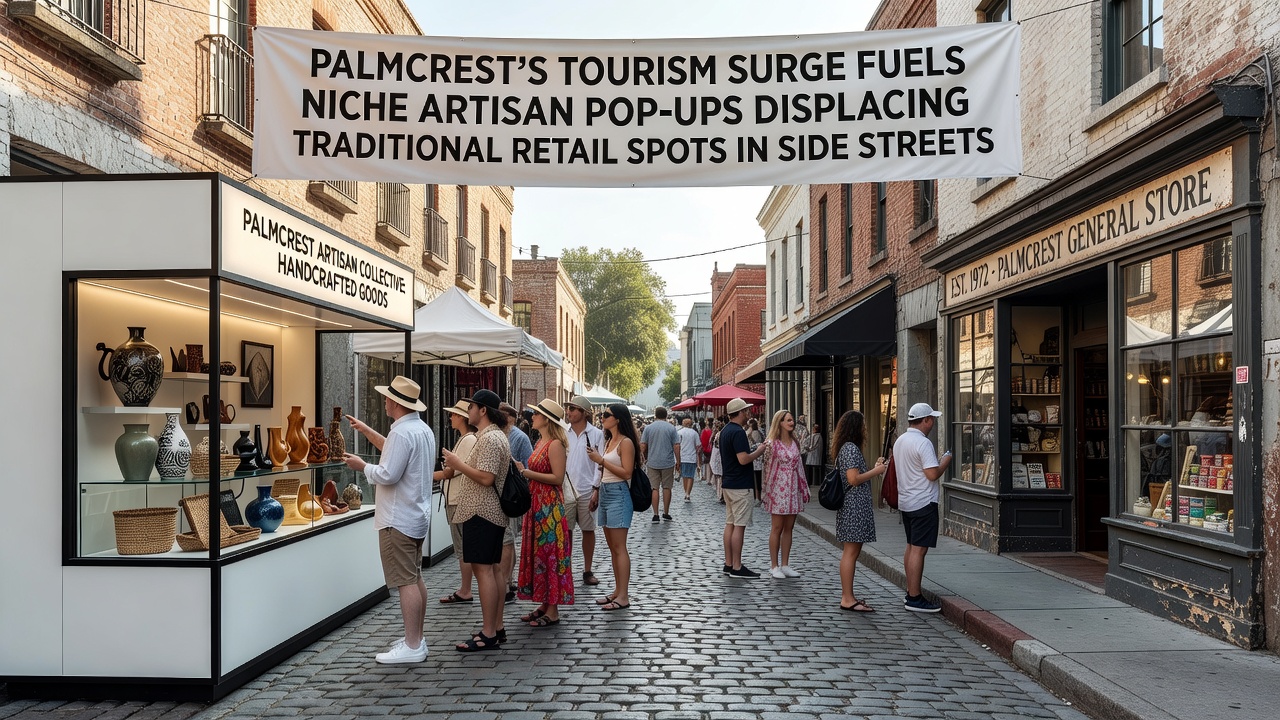
Visitor arrivals in Palmcrest rose steadily through 2025 and into 2026, with local records showing a 28 percent increase compared with the previous three-year average, according to municipal tourism data compiled in September 2026. This growth brought new foot traffic to side streets that previously hosted mostly long-standing hardware stores, clothing outlets, and small grocers. Many of those traditional businesses began reporting lower footfall as temporary stalls offering handmade ceramics, specialty soaps, and small-batch preserves opened in the same blocks.
Visitor Patterns and Street-Level Changes
Observers note that tourists arriving via the expanded ferry service and the newly reopened coastal rail spur tended to explore secondary lanes rather than stay on the main commercial avenue. City planning reports from the same period document 47 new short-term vendor permits issued between January and August 2026, most of them for spaces under 200 square feet. Traditional retailers, meanwhile, recorded an average 19 percent drop in daily transactions during peak tourist months, based on sales tax filings submitted to teh regional revenue office.
Those who've tracked leasing records point out that several corner shops vacated their premises after lease renewals pushed rents upward by roughly 35 percent over two years. In their place, pop-up operators signed flexible three-month agreements that allowed quick rotation of inventory and lower overhead. Data from the local business registry shows 22 such short-term tenancies active in September 2026, compared with only four the year before.
Artisan Operators and Supply Chains
Artisan vendors sourcing materials from nearby coastal workshops and inland farms set up displays that changed weekly. One operator who previously sold online only opened a stall in a former stationery store and reported moving 60 percent of annual volume during the summer season alone. Researchers from teh regional economic development institute documented similar patterns across eight comparable coastal towns, noting that flexible licensing rules adopted in 2024 enabled faster permitting for these temporary outlets.
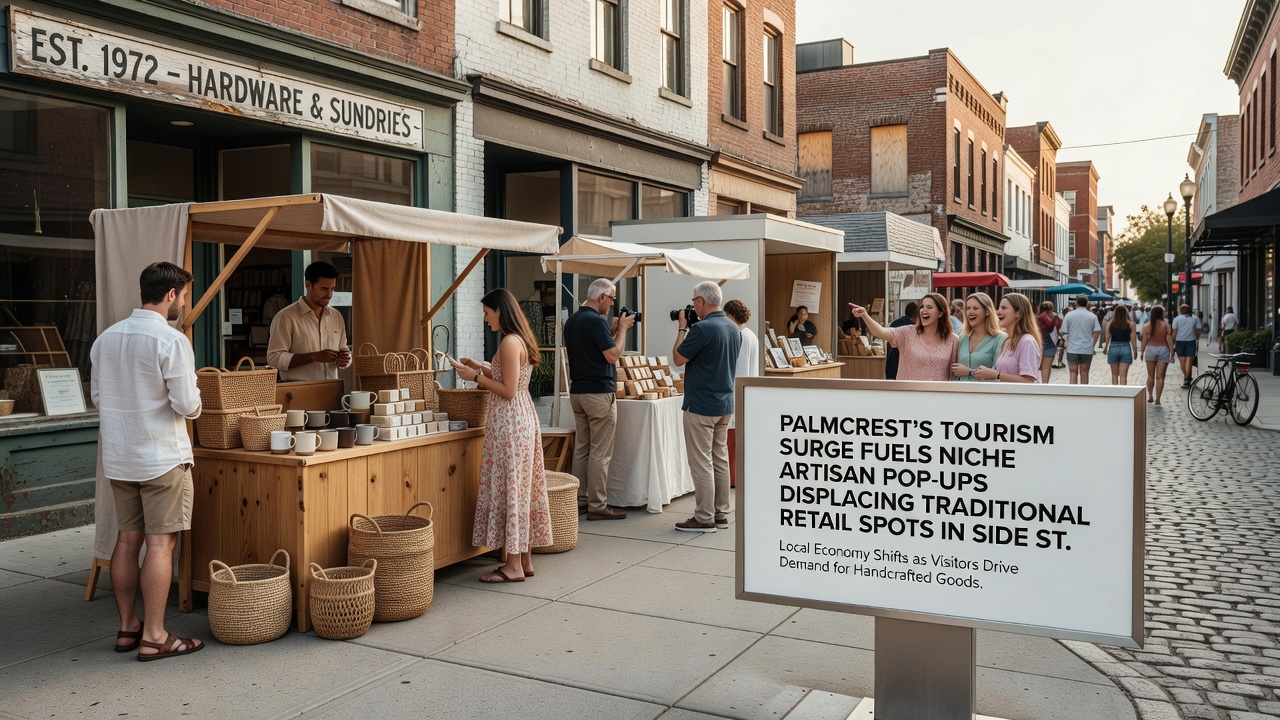
Supply chains adapted as well. Wholesale distributors that once delivered to fixed retail locations began offering smaller, more frequent shipments suited to pop-up schedules. Trade association figures from the National Small Business Federation indicate that 14 percent of member firms in tourism-adjacent sectors now use such hybrid distribution models, up from 6 percent in 2023.
Employment and Revenue Shifts
Employment data reveals a parallel transition. While three traditional retailers reduced staff by a combined 11 positions, the new stalls created 27 part-time vendor roles during the same interval. Payroll records filed with the state labor department show average hourly earnings in these roles slightly above the prior retail average, though without benefits packages that longer-term employees had received. Studies conducted by the Coastal Economic Research Center found that 41 percent of the new hires were local residents previously working in seasonal hospitality.
Property owners adjusted lease structures in response. Several buildings on the affected side streets now offer revenue-sharing arrangements rather than fixed monthly rents, allowing landlords to capture a percentage of daily sales during high-traffic periods. Municipal tax assessments from September 2026 list increased assessed values for eight parcels that had hosted pop-ups for at least four months.
Regulatory and Infrastructure Context
City council minutes from mid-2026 record discussions about updating sidewalk usage ordinances to accommodate more temporary structures while maintaining emergency access lanes. The regional transit authority simultaneously released ridership numbers showing a 22 percent rise in stops at the two side-street stations most popular with visitors. Infrastructure upgrades, including new lighting and waste collection points, were completed in July 2026 using funds from the coastal improvement grant program.
Those monitoring commercial vacancy rates report that overall storefront availability on the main avenue remained stable, whereas side-street vacancy fell from 18 percent to 9 percent over the same twelve months. The pattern suggests displacement occurred within a concentrated geography rather than across the entire commercial district.
Conclusion
Records compiled through September 2026 illustrate how increased visitor volume coincided with measurable changes in the composition of side-street commerce in Palmcrest. Short-term artisan operations expanded under flexible permitting, while several longstanding retailers adjusted or relocated. Employment numbers shifted toward part-time roles, and lease arrangements evolved to reflect variable foot traffic. Municipal data and industry reports continue to track these developments as visitor patterns stabilize.